


How to Spot Leading Stocks in a Bear Market with 2-time U.S. Investing Champion Mark Minervini
27 February 2025


In correction best thing is to start from cash and then look for winning stocks.
Three type of stocks:
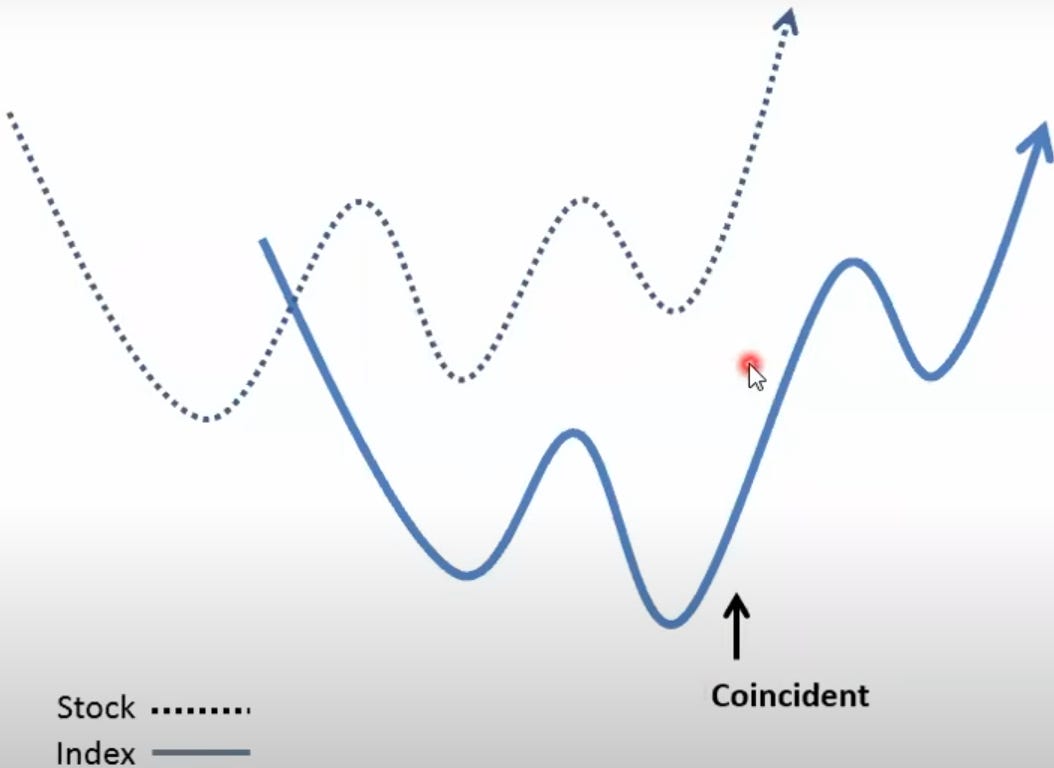
Stock breaking out while the market is still in correction


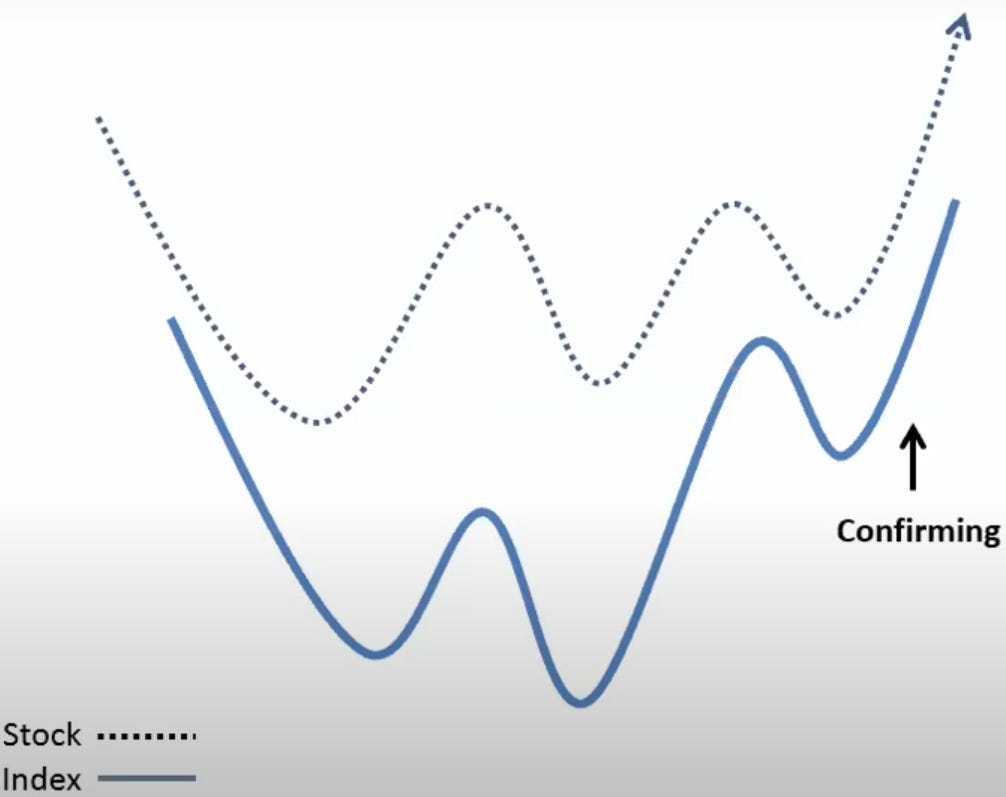
Market made a bottom and followed through on upside but stock gave a breakout.

Market is healthy and stock also gave a breakout.


WHAT TO LOOK FOR
History shows that more than 96% of super-performance stocks emerge from bear markets and general market corrections. Do your homework while the market is down and you will be prepared to make big profits when it turns up.
Off the general market low, look for the following:
Stocks that corrected the least amount during the market's declining period trading within 25% of a 52-week high (the closer to a new high the better). Stocks that go down the least are going to go up the most in next bull market (look for stocks that are moving up while market is still in correction, Stocks that bounce back quickly from their lows while market is still correcting or flat).

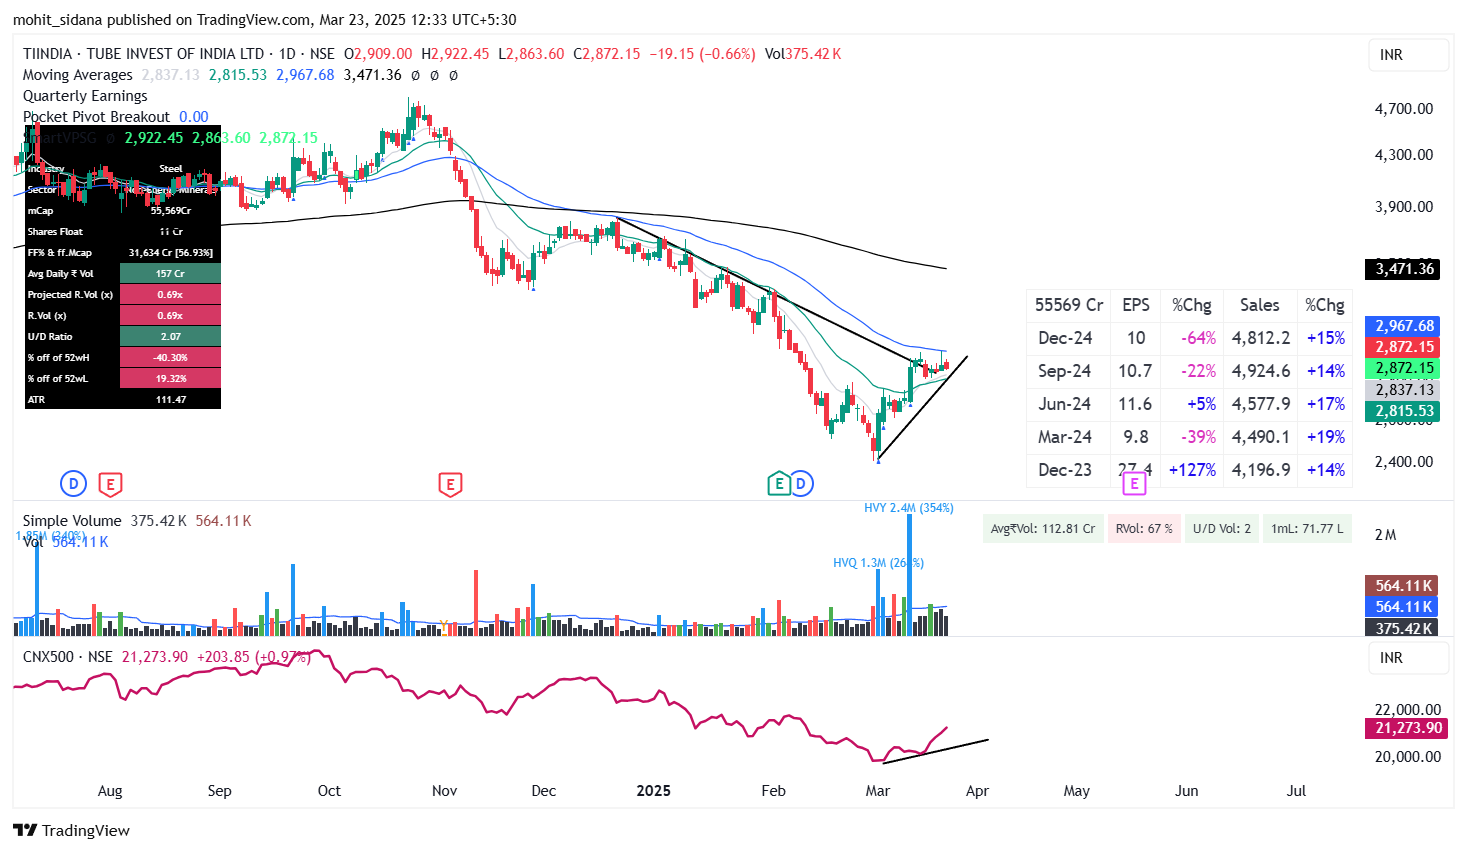
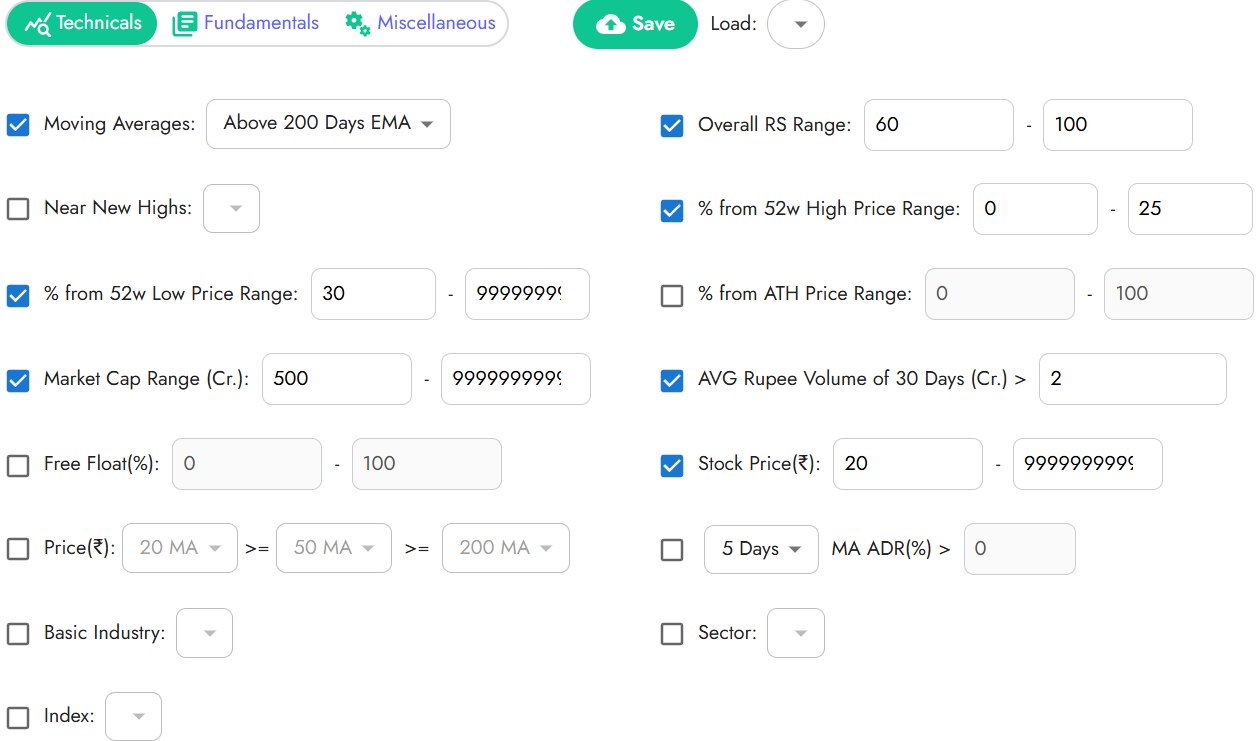
You can create this screen on ChartsMaze and look for strong stocks
Minervini Trend template screen:
→The current stock price is above both the 150-day (30-week) and the 200-day (40-week) moving average price lines.
→The 150-day moving average is above the 200-day moving average.
→The 200-day moving average line is trending up for at least 1 month (preferably 4-5 months minimum in most cases).
→The 50-day (10-week) moving average is above both the 150-day and 200-day moving averages.
→The current stock price is trading above the 50-day moving average.
→The current stock price is at least 30 percent above its 52-week low. (Many of the best selections will be 100 percent, 300 percent, or greater above their 52-week low before they emerge from a solid consolidation period and mount a large scale advance.)
→The current stock price is within at least 25 percent of its 52-week high (the closer to a new high the better).
→The relative strength ranking (as reported in Investor's Business Daily) is no less than 70, and preferably in the 80s or 90s, which will generally be the case with the better selections.
Look for Minervini Trend template both 1 &5 month, Blue dot screen on marketsmithindia
Stocks that are base-building; consolidating within the context of a long-term uptrend.

Stocks that surged in price off the market lows; the largest percentage movers.
Recent IPOs coming out of bases.


A proliferation of stocks emerging through proper buy points out of bases.


Want to see
Proliferation of stocks "setting-up".
Recent trades and set ups showing a string of gains.
Signs of accumulation in the major averages.
Don't want to see
Number of stocks "setting-up" diminishing.
Recent trades have produced a string of losses.
Signs of institutional distribution in the major averages.
Let the stock price guide you not the news
- Mark Ritchie II
For more watch this video:
Everyone should also read Mark Minervini books to better understand his process: